- Divide 210 by 45, and get the result 4 with remainder 30, so 210=4·45+30.
- Divide 45 by 30, and get the result 1 with remainder 15, so 45=1·30+15.
- Divide 30 by 15, and get the result 2 with remainder 0, so 30=2·15+0. The greatest common divisor of 210 and 45 is 15.

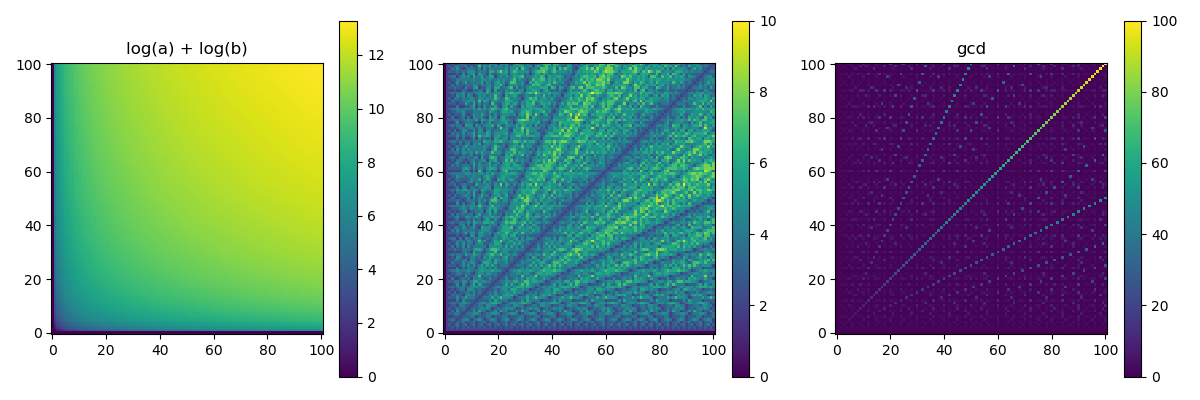
The following functions should be shown on the heat maps:
- The first heat map shows the function \(\log_2 a + \log_2 b\), which is generated by the program euclidean.py.
- The second heat map shows the number of steps of the Euclidean algorithm on each pair \((a, b)\). On the number of steps we mean: how many divisions with reminder made on \((a_i, b_i)\) pairs or decide to stop.
- The third heat map shows the value \(\mathop{\mathrm{gcd}}(a, b)\).
plt.subplot(132)
means that the canvas has 3 subfigures in a row, and all the results
of the function calls
of plt appear on the
second subfigure.