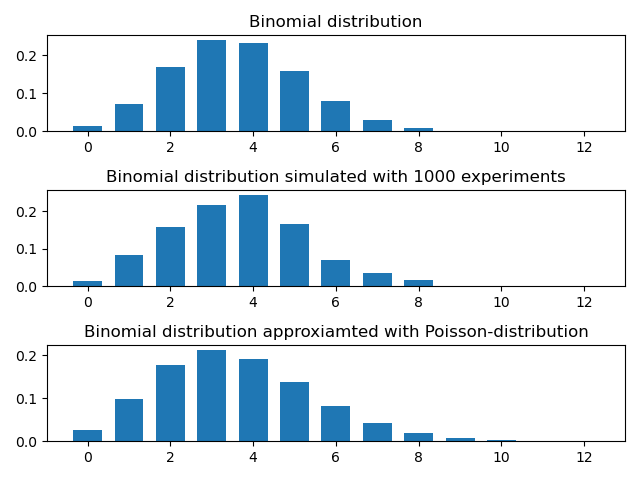
In this task you have to plot three diagrams in a figure. The first diagram shows the binomial distribution with paramteres \((n,p)\) (the title is "Binomial distribution"). The second diagram shows the result of the simulation of this distribution (the title is "Binomial distribution simulated with 1000 experiments"). The third picture shows the first \(n+1\) columns of the diagram of the Poisson distribution with parameter \(\lambda=n\cdot p\) which approximates our binomial distribution (the ttitle is "Binomial distribution approxiamted with Poisson-distribution").
The output of this program will look like this (the scale and color is not an essential part of the figure):
The inputs are \(n\), \(p\), \(k\), where \(n\) and \(p\) are the parameters of the binomial distribution, and \(k\) is the number of simulations. The file should be called binom.py and be run by the next command:
python3 binom.py 12 0.3 1000
main() should return the object of type pyplot used for plotting. For example:
import matplotlib.pyplot as plt

...

def main():
    fig = plt.figure(figsize=(10, 5))

    ...

    return fig

if __name__ == "__main__":
    main()
The command arguments can be read out from the inbuilt array sys.argv:
import sys

print(f'n: {sys.argv[1]}, p: {sys.argv[2]}, k: {sys.argv[3]}')
print(f"The name of this program has {len(sys.argv[0]):2} characters")
The sys.argv[0] contains the name of the program, the len() function gives the length of it.
Do not forget to convert sys.argv[1],... into numbers (int, float).
Test your program with different parameters like 20 0.05 1000, 40 0.02 1000 or 40 .5 1000.
The simulation of this binomial distribution can be accomplished by executing \(n\) times an event of probability \(p\). The value of the random variable is \(m\) if the event occurred $m$ times in the \(n\) experiments. We repeat this \(n\) experiment \(k\) times so we get \(k\) values of the random variable. The \(m\)-th column of the second diagram should be \(i/k\) if the value of the random variable was \(m\) exactly \(i\) times from the \(k\) values. (This part of the program can be written simply by loops using the random function of the random modul.)
The third diagram shows the first \(n+1\) values of a random variable \(X\) of Poisson distribution with parameter \(\lambda=np\), where \[ \mathbb{P}(X=m)=\frac{\lambda^m}{m!}e^{-\lambda}, \quad m=0, 1, 2,\dots.\]
The aim of this exercise is to practice, simulate, approximate and better understand the binomial distribution.
Programming goal is to learn the command line running of programs, plotting diagrams as subfigures.